2011年11月18日星期五
种间杂种不亲和的遗传学
The Genetics of Hybrid Incompatibilities
http://www.annualreviews.org/doi/abs/10.1146/annurev-genet-110410-132514
这篇综述给出了种间杂种不亲和的研究方法、可能机制。
2011年11月16日星期三
Slopegraphs - a useful tools
1. for introduction of slopegraphs
http://charliepark.org/slopegraphs/
 2. for generating slopegraphs with R
http://www.jameskeirstead.ca/r/slopegraphs-in-r/
http://charliepark.org/slopegraphs/
http://www.jameskeirstead.ca/r/slopegraphs-in-r/
2011年11月8日星期二
outcrossing and selfing in plants - evolutionary and genomic consequence
- DOI: 10.1086/523362Stable URL: http://www.jstor.org/stable/10.1086/523362
 DOI: 10.1086/523366Stable URL: http://www.jstor.org/stable/10.1086/523366
2011年11月6日星期日
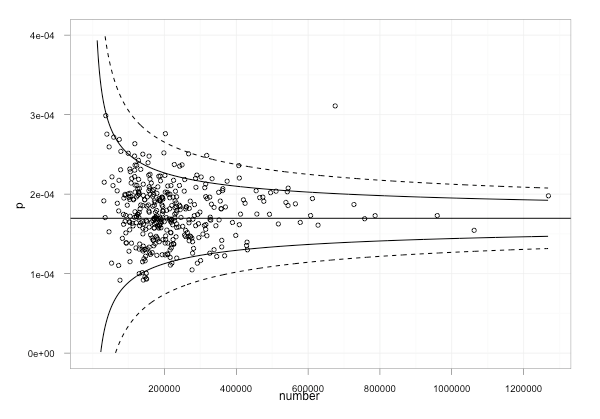
funnel plot
A funnel plot is a scatterplot of treatment effect against a measure of study size. It is used primarily as a visual aid to detecting bias or systematic heterogeneity. A symmetric inverted funnel shape arises from a ‘well-behaved’ data set, in which publication bias is unlikely. An asymmetric funnel indicates a relationship between treatment effect and study size.
A funnel plot is a useful graph designed to check the existence of publication bias in systematic reviews and meta-analyses. It assumes that the largest studies will be near the average, and small studies will be spread on both sides of the average. Variation from this assumption can indicate publication bias.
http://en.wikipedia.org/wiki/Funnel_plot
 http://ouseful.files.wordpress.com/2011/10/cancerdatafunnelplot.png?w=600&h=419
A funnel plot is a useful graph designed to check the existence of publication bias in systematic reviews and meta-analyses. It assumes that the largest studies will be near the average, and small studies will be spread on both sides of the average. Variation from this assumption can indicate publication bias.
http://en.wikipedia.org/wiki/Funnel_plot
2011年11月3日星期四
constrained elements in the human genome as revealed by mammalian alignments of 29 genomes
http://www.nature.com/nrg/journal/vaop/ncurrent/full/nrg3112.html
- Lindblad-Toh, K. et al. A high-resolution map of human evolutionary constraint using 29 mammals. Nature 12 Oct 2011 (doi: 10.1038/nature10530)
- Lin, M. F. et al. Locating protein-coding sequences under selection for additional, overlapping functions in 29 mammalian genomes. Genome Res. 12 Oct 2011 (doi: 10.1101/gr.108753.110)
订阅:
博文 (Atom)