2011年10月28日星期五

What do we need to know about speciation

http://www.sciencedirect.com/science/article/pii/S0169534711002618#sec2.1

Article Outline

Quantifying effects of environmental and geographical factors on patterns of genetic differentiation

The authors used a regression-based approach to simultaneously estimate the quantitative contributions of environmental adaptation and isolation by distance on genetic variation in Boechera stricta, a wild relative of Arabidopsis.

http://onlinelibrary.wiley.com/doi/10.1111/j.1365-294X.2011.05310.x/abstract

2011年10月27日星期四

Dated origin of Arabidopsis thaliana - 13 Mya

This paper gave much more robust dating for origin of Arabidopsis thaliana:

Dated molecular phylogenies indicate a Miocene origin for Arabidopsis thaliana

http://www.pnas.org/content/107/43/18724.long

We bring previously overlooked fossil evidence to bear on these questions and find the split between A. thaliana and Arabidopsis lyrata occurred about 13 Mya, and that Arabidopsis and the Brassica complex (broccoli, cabbage, canola) occurred about 43 Mya


正态检验的用途 - 似乎不大 - 要小心

1. Normality tests don't do what most think they do. Shapiro's test, Anderson Darling, and others are null hypothesis tests AGAINST the the assumption of normality. These should not be used to determine whether to use normal theory statistical procedures. In fact they are of virtually no value to the data analyst. Under what conditions are we interested in rejecting the null hypothesis that the data are normally distributed? I have never come across a situation where a normal test is the right thing to do. When the sample size is small, even big departures from normality are not detected, and when your sample size is large, even the smallest deviation from normality will lead to a rejected null.

http://stackoverflow.com/questions/7781798/seeing-if-data-is-normally-distributed-in-r/

2. I, personally, have never come across a situation where a normal test is the right thing to do. The problem is that when the sample size is small, even big departures from normality are not detected, and when your sample size is large, even the smallest deviation from normality will lead to a rejected null.

http://blog.fellstat.com/

HyPhy - Hypothesis testing using phylogenies

1. HyPhy is a scriptable package that can fit statistical evolutionary models to alignment of homologous sequences using Maximum likelihood 2), estimate various parameters that have biological meaning, for example branch lengths, substitution rates, dN/dS ratios, recombination breakpoints, and test hypotheses about how sequences in the alignment have evolved. HyPhy focuses on inference about the evolutionary process. Even though it can do limited alignment and phylogenetic reconstruction, much better specialized programs exist for these purposes.
Here are some of the applications that HyPhy is often used for:
  • Positive and negative selection detection
  • Recombination analysis
  • Detecting co-evolving residues
  • Genomic and multiple-gene evolutionary inference
  • Molecular clock and relative rate tests
  • Nucleotide, protein and codon model selection
  • As a likelihood analysis engine for other software and web services
  • One-off analyses: tasks that no other package does out of the box and are not worth writing a specialized program for
http://www.datam0nk3y.org/hyphy/doku.php

2. Some of the most popular HyPhy functions (recombination, positive selection detection, etc) are implemented in a web-server hosted at http://www.datamonkey.org

Which codon sites are under diversifying positive or negative selection?
Three different codon-based maximum likelihood methods, SLAC, FEL and REL, can be used estimate the dN/dS (also known as Ka/Ks or ω) ratio at every codon in the alignment. An exhaustive discussion of each approach can be found in the methodology paper. All methods can also take recombination into account. This is done by screening the sequences for recombination breakpoints, identifying non-recombinant regions and allowing each to have its own phylogentic tree.
Is there evidence of selection in my alignment?
The PARRIS method, developed by Konrad Scheffler and colleagues, extends traditional codon-based likelihood ratio tests to detect if a proportion of sites in the alignment evolve with dN/dS>1. The method takes recombination and synonymous rate variation into account.
What is the evolutionary fingerprint of a gene?
The ESD method, described in a recent paper, fits a versatile general discrete bivariate model of site-by-site selective force variation to partition all sites into selective classes, and obtains an approximate posterior distribution of this partititoning. The resulting "noisy" distribution of selective regimes is the evolutionary fingerprint of a gene. The EVF (evolutionary fingerprinting) module implements this procedure, and can also infer which individual sites appear to be positively selected while accounting for parameter estimation error (analogous to the BEB methodology of the PAML package).
Which codon sites are under positive or negative selection at the population level?
The codon-based maximum likelihood IFEL method can investigate whether sequences sampled from a population (e.g. viral sequences from different hosts) have been subject to selective pressure at the population level (i.e. along internal branches). A discussion of the method and its application can be found here
Did selective pressure vary along lineages, i.e. over time?
The codon-based genetic algorithm GABranch method can automatically partition all branches of the phylogeny describing non-recombinant data into groups according to dN/dS. Robust multi-model inference is used to collate results from all models examined during the run to provide confidence intervals on dN/dS for each branch and guard against model misspecification and overfitting (method details).
How about episodic diversifying selection (branch-site methods)? Using the modeling framework, which allows the efficient estimations with models which permit dN/dS variation along both sites and lineages, Datamonkey implements two tests geared towards finding lineages and sites subject to episodic diversifying selection (EDS).
The Branch-site REL method, identifies those branches where a proportion of sites evolves under EDS. If you are primarily interested in finding which lineages (but don't care about which sites) have experienced EDS, use this method. Alternatively, if you are interested in sites (but don't care about which lineages) subject to EDS, then the MEME method is appropriate.
What about different types of selection?
Protein sequences can be screened for evidence of directional using the DEPS method, described here, useful when one wants to detect convergent evolution or selective sweeps. For coding sequences, the TOGGLE model, developed by Wayne Delport and colleagues, can detect selection-driven changes that result in amino-acid toggling. A canonical example of this can be found in immune-driven evolution of HIV-1 (escape and reversion).
Which evolutionary model should I use for my data?
For each type of data, nucleotide, amino-acid and codon, Datamonkey implements separate model selection procedures. An exhaustive search is performed for all possible (Markov, time-reversible) models of nucleotide evolution. For protein data, a collection of published empirical models are fitted to the alignment and the best one is selected using AICc. Finally, for coding data, a sophisticated genetic-algorithm procedure described in our recent paper is used to examine thousands of potential models and report the best one and various metrics based on the set of credible models - this feature is implemented in the CMS module.
Did any sites co-evolve?
A Bayesian graphical model is deduced from reconstructed substitutions at each branch/site combination to infer conditional evolutionary dependancies of sites in the alignments, i.e. whether a site is more or less likely to experience a non-synonymous substitution at a branch when certain other sites do (or do not) experience non-synonymous substitutions at the same branch. The SPIDERMONKEY method was introduced in the evolutionary context in our paper on the evolution of the phenotypically important and highly variable V3 loop of the envelope glycoprotein in HIV-1.
Has recombination acted upon sequences in an alignment?
Recombination leaves an imprint on sequence alignments: different segments of the alignment may be described by different phylogenetic trees, called phylogenetic discordance. Datamonkey.org implementes two methods: SBP, suitable for answering the question "Is there evidence of recombination in the alignment?", and GARD, that attempts to find all the recombination breakpoints. Both method are described in this paper. The output of GARD is accepted by most other analyses, and because recombination can mislead phylogenetic analysis that do not account for it, we strongly urge that recombination testing be done on any alignment that is going to be analyzed for positive selection.You can also submit a collection of HIV-1 sequences for recombination screening by a specialized recombination detection algorithm SCUEAL described in this paper.
What were the ancestral sequences?
The ASR module implements three different approaches to reconstructing ancestral sequences: joint, marginal and sampled - see this paper for a description and original methodology attribution, from simple or partitioned alignments.
3. One functionality from HyPhy:

A random effects branch-site model for detecting episodic diversifying selection

http://mbe.oxfordjournals.org/content/early/2011/06/11/molbev.msr125.abstract

2011年10月26日星期三

synonymous/nonsynonymous mutation rate (Ks/Kn)

(1) Ks saturation (Ks > 1):
http://biostar.stackexchange.com/questions/13501/ks-saturation-after-a-pairwise-comparison-analysis-using-codeml

http://sysbio.oxfordjournals.org/content/57/3/367.full
It has been widely accepted that synonymous substitutions may saturate quickly as sequences diverge (e.g., Maynard Smith and Smith, 1996). The analysis of mammal and yeast data reveals that synonymous substitutions are very important and should not be ignored.


(2) intraspecific
(2.1) if you have intraspecific polymorphism data, you should be calculating pi or theta (not Ka or Ks) for synonymous and non-synonymous sites.

http://biostar.stackexchange.com/questions/12153/ka-ks-ratio-to-detect-selection-nonsynonmous-to-synonymous-in-dnasp

(2.2) Within populations or species, there are suggestions that ka/ks may not be a good measure of selective constraints because the selection and ka/ks ratio doesn't follow a monotonic function. See http://www.plosgenetics.org/article/info:doi/10.1371/journal.pgen.1000304 from the Plotkin lab. If I were to use ka/ks here, I'll try codon-based approach implemented in HyPhy to see site and lineage specific dN/dS ratio. Also, I think it might be a better idea to explore population genetics based approach, like Tajima's D, to test the null hypothesis of neutral evolution.
To answer your direct questions, yes, you input all coding sequences, and you do get average values from all pairwise comparisons. But I wonder whether you'll see any significant values because they should be all highly similar.

http://biostar.stackexchange.com/questions/12174/ka-ks-ratio-for-within-a-gene-very-confused

(3) new models on mutation and selection

(3.1) Statistical Comparison of Nucleotide, Amino Acid, and Codon Substitution Models for Evolutionary Analysis of Protein-Coding Sequences

http://sysbio.oxfordjournals.org/content/early/2009/06/29/sysbio.syp015.full

(3.2) Mutation-selection models of coding sequence evolution with site-heterogeneous amino acid fitness profiles
http://www.pnas.org/content/107/10/4629.full

(4) The Population Genetics of dN/dS

http://www.plosgenetics.org/article/info:doi/10.1371/journal.pgen.1000304

material resources for Arabidopsis analysis

拟南芥研究的生物物质资源:

1、这是所有资源类别的列表
http://www.arabidopsis.org/servlets/Order?state=catalog

2、拟南芥天然群体取样个体列表
http://www.arabidopsis.org/abrc/catalog/natural_accession_1.html

visualizing your interests on pathway

These two questions in BioStar would be helpful, if you want to visualize what you are interested in on pathways.


http://biostar.stackexchange.com/questions/13361/overlaying-gene-expression-results-on-metabolic-pathways

http://biostar.stackexchange.com/questions/4813/tools-for-visualizing-significantly-altered-pathways-and-related-genes-in-a-pathw

2011年10月24日星期一

turtorials of PCA with R

http://gettinggeneticsdone.blogspot.com/2010/05/tutorial-principle-components-analysis.html

http://programming-r-pro-bro.blogspot.com/2011/10/principal-component-analysis-use.html

http://programming-r-pro-bro.blogspot.com/2011/10/principal-component-analysis-use_23.html

2011年10月23日星期日

genetic/genomic bases of local adaptation

A Map of Local Adaptation in Arabidopsis thaliana

http://www.sciencemag.org/content/334/6052/86.full


 http://www.sciencemag.org/content/334/6052/49.full


2011年10月21日星期五

minicourse of R and Latex

http://scc.stat.ucla.edu/mini-courses/materials-from-past-mini-courses/

Winter 2010 Mini-Course Materials

Winter 2010 Schedule

Date Topic Stats 285 Track Presenter Materials
Week 1
January 4 Organizational Meeting for Statistics 285 n/a Mahtash Esfandiari
January 6 Basic Statistics and Introduction to Graphics in R R Graphics Brigid Brett-Esborn


Week 2
January 11 LaTeX I: Writing a Paper or Thesis in LaTeX LaTeX David Diez


January 13 LaTeX II: Bibliographies, Style and Math in LaTeX LaTeX David Diez


Week 3
January 20 LaTeX III: Sweave – Embedding R in LaTeX LaTeX Colin Rundel


Week 4
January 25 Intermediate Graphics in R R Graphics Irina Kukuyeva


January 27 Advanced Graphics in R R Graphics Ryan Rosario


Week 5
February 1 Introductory Statistics in R R Stats Mine Cetinkaya


February 3 LaTeX IV: Academic Talks and Presentations in LaTeX LaTeX Mine Cetinkaya


Week 6
February 8 Intermediate R R Stats Denise Ferrari


February 10 Linear Regression R Stats Tiffany Himmel


Week 7
February 17 Nonlinear Regression R Stats Tiffany Himmel


Week 8
February 22 Survival Analysis in R R Stats Mine Cetinkaya


February 24 Spatial Statistics in R R Stats David Diez


Week 9
March 1 Time Series in R R Stats Irina Kukyeva


March 3 Advanced Topics in R R Stats TBA

Visualizing 3d data by plotting quartiles separately - good idea

Here, the author presented a nice way to present 3d data - by plotting quartiles separately.
http://gossetsstudent.wordpress.com/2010/07/30/visualizing-3d-data-plotting-quartiles-separately/

Visualizing genomes: techniques and challenges

http://www.nature.com/nmeth/journal/v7/n3s/full/nmeth.1422.html

2011年10月20日星期四

comparative genomics tools - alignment tools

Custom Alignment

We have developed several comparative genomics servers that calculate pairwise and multiple alignments of user-submitted sequences of any length and perform associated conservation analysis.
The user-friendly visualization technique implemented in our servers allows a biomedical researcher to analyze megabases of sequence alignments with underlying sequence annotation, predicted transcription factor binding sites, and evolutionary relationships.
  • mVISTA

    Align and compare your sequences from multiple species
  • rVISTA

    (regulatory VISTA) combines transcription factor binding sites database search with a comparative sequence analysis. It can be used directly or through mVISTA, Genome VISTA, or VISTA Browser.
  • GenomeVISTA

    compare your sequences with several whole genome assemblies. It will automatically find the ortholog, obtain the alignment and VISTA plot..
  • wgVISTA

    Align sequences up to 10Mb long (finished or draft) including microbial whole-genome assemblies.
  • Phylo-Vista

    Analyze multiple DNA sequence alignments of sequences from different species while considering their phylogenic relationships.

comparative genomics tools - whole genome alignments

Here you could find whole genome alignments for different genome pairs, these alignments are usually crucial for a comparative genomic study.

http://pipeline.lbl.gov/downloads.shtml

Alignments

Human - Rhesus - Horse - Dog - Mouse - Rat - Chicken 14-May-2008
Human - Orangutan - Rhesus - Marmoset 14-Dec-2007
Human - Chimp 09-Apr-2007
Human - Dog 02-Apr-2007
Human - Mouse 27-Mar-2007
Human - Dog - Mouse - Rat - Chicken 3-Dec-2006
Human (Jul. 2003) - Mouse - Rat 14-Mar-2004
Human (Apr. 2003) - Mouse - Rat 22-Aug-2003

A. thaliana Jun. 2009 (TAIR9)

Arabidopsis - Maize B73 v.2 16-Jun-2010
Arabidopsis - M. esculenta v.4 13-Jul-2010
Arabidopsis - M. guttatus v.1.0 27-Dec-2009
Arabidopsis - M. truncatula Mt3.0 25-Dec-2009
Arabidopsis - Papaya 25-Dec-2009
Arabidopsis - Poplar v.2.0 23-Dec-2009
Arabidopsis - P. patens v.1.1 07-Feb-2010
Arabidopsis - Rice v.6.0 25-Dec-2009
Arabidopsis - S. moellendorffii v.1.0 08-Feb-2010
Arabidopsis - Soybean 24-Dec-2009
Arabidopsis - Wine grape 17-Jul-2010
Arabidopsis - A. lyrata - T. halophila - C. papaya - C. clementina 11-Mar-2011

Poplar v.2.0

Poplar - Rice v.6.0 23-Dec-2009
Poplar - Papaya 26-Dec-2009

Rice v.6.0

Rice - Papaya 26-Dec-2009

A. thaliana Apr. 2008 (TAIR8)

Arabidopsis - A. lyrata 30-Jul-2008
Arabidopsis - Soybean 03-Dec-2008
Arabidopsis - Poplar v.1.1 30-Sep-2008
Arabidopsis - Medicago 18-Dec-2008
Arabidopsis - Papaya 17-Dec-2008
Arabidopsis - Wine grape 15-Aug-2008

A. thaliana Mar. 2004

Arabidopsis - Rice v.1.0 28-Jan-2005
Arabidopsis - Sorghum 04-Jan-2008
Arabidopsis - Poplar v.1.1 11-Aug-2005

Poplar v.1.1

Poplar - Arabidopsis 11-Aug-2005
Poplar - Rice v.3.0 11-Aug-2005
Poplar - Poplar 11-Aug-2005

Sorghum v.1.0

Sorghum - Arabidopsis - Rice v.5.0 22-Apr-2008
Sorghum - Sorghum 23-May-2007
Sorghum - Rice v.5.0 10-Apr-2007
Sorghum - Rice v.6.0 28-Dec-2009
Sorghum - Maize 06-Jun-2007

A. niger v.1.0

A. niger - A. fumigatus 23-Mar-2006
A. niger - A. nidulans 16-Mar-2006
A. niger - A. oryzae 23-Mar-2006

D. melanogaster Oct. 2006

D. melanogaster - D. pseudoobscura - D. yakuba - D. ananassae - D. erecta - D. simulans 13-Mar-2008

D. melanogaster Apr. 2004

D. melanogaster - D. simulans 15-July-2005
D. melanogaster - D. pseudoobscura 29-Mar-2005
D. melanogaster - D. ananassae 29-Mar-2005
D. melanogaster - D. mojavensis 29-Mar-2005
D. melanogaster - D. yakuba 29-Mar-2005
D. melanogaster - D. virilis 29-Mar-2005
D. melanogaster - D. erecta 29-Mar-2005

D. melanogaster Jan. 2003

D. melanogaster - D. pseudoobscura (LAGAN) 20-Sep-2004
D. melanogaster - D. pseudoobscura (AVID) 13-Aug-2004
D. melanogaster - D. ananassae 20-Sep-2004
D. melanogaster - D. mojavensis 20-Sep-2004
D. melanogaster - D. virilis 21-Sep-2004
D. melanogaster - D. yakuba 21-Aug-2004


Ciona intestinalis v.1.0 - Ciona savignyi 13-Aug-2004
Ciona intestinalis v.2.0 - Ciona savignyi 29-Nov-2005


Human (NCBI build 30) - Mouse (MGSCv3) (all alignments) 04-Nov-2002
Human (NCBI build 30) - Mouse (MGSCv3) (filtered alignments) 4-Nov-2002
Notes for this run


Escherichia coli O6 CFT073 25-May-2005 SLAGAN

2011年10月19日星期三

the Systematic Investor Toolbox - useful tools

1. the Systematic Investor Toolbox is here:
https://github.com/systematicinvestor/SIT

2. it has been introduced here:
 http://systematicinvestor.wordpress.com/

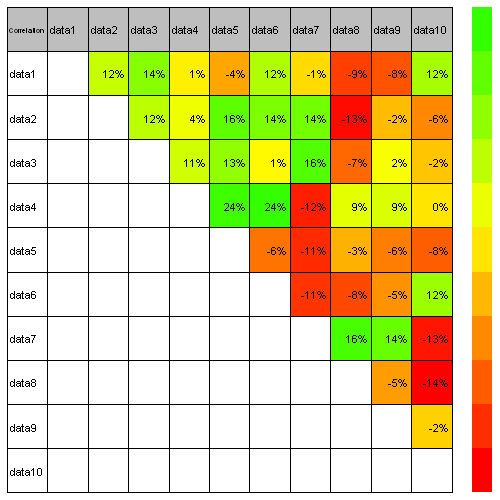
3. plot.table function

plot.table function in the Systematic Investor Toolbox is a flexible table drawing routine. plot.table has a simple interface and takes following parameters:
  • plot.matrix – matrix with data you want to plot
  • smain – text to draw in (top, left) cell; default value is blank string
  • highlight – Either TRUE/FALSE to indicate if you want to color each cell based on its numeric value Or a matrix with colors for each cell
  • colorbar – TRUE/FALSE flag to indicate if you want to draw colorbar
4.
PloTA ( plot + ta ) library in the Systematic Investor Toolbox is a simple plot interface to charting Time Series and Technical Analysis plots. I created it as an alternative to charting functionality in quantmod package. It is designed to mimic default plot interface and works with xts objects. PloTA implements following methods:
  • plota – main plot method
  • plota2Y – add second Y axis to existing plot
  • plota.lines – plot lines
  • plota.candle – plot Candle
  • plota.ohlc – plot Open/High/Low/Close
  • plota.hl – plot High/Low
  • plota.volume – plot Volume
  • plota.scale.volume – scale Volume
  • plota.grid – add grid
  • plota.legend – plot legend
  • plota.layout – specify plot layout
  • plota.theme.blue.red – color theme
  • plota.theme.green.orange – color theme
  • plota.theme.gray.orange – color theme

10 rules for genomics

Here from Ewan's blog, 10 rules for genomics

http://genomeinformatician.blogspot.com/2011/07/10-rules-of-thumb-in-genomics.html

2011年10月18日星期二

GeCo++

GeCo++: a C++ library for genomic features computation and annotation in the presence of variants

http://bioinformatics.oxfordjournals.org/content/27/9/1313.full

http://bioinformatics.emedea.it/geco/

http://bioinformatics.emedea.it/geco/doc/geco_tutorial.html, this tutorial give a comparison between GeCo and R on NGS analysis. So you could learn much about R/bioconductor.

two variables correlation can be presented as smoothed color density plot

1. Here is an example:
(http://sas-and-r.blogspot.com/2011/07/example-92-transparency-and-bivariate.html?utm_source=feedburner&utm_medium=feed&utm_campaign=Feed%3A+SASandR+%28SAS+and+R%29)
(please go to scatterSmooth function)

2. another example
http://princeofslides.blogspot.com/2011/02/fixing-up-smoothscatter-heat-maps.html

blogs on SAS

If you are using SAS, please come here:

1.
http://blogs.sas.com/content/iml/

2.
http://sas-and-r.blogspot.com/

2011年10月17日星期一

Linear mixed modelers in R

1. Here Luis, gave a very nice introduction on mixed modeling with R
http://www.quantumforest.com/2011/10/linear-mixed-models-in-r/#idc-container

2. please go the the comments of this blog post, there are many informative comments, especially Lars pointed out his hglm package. It is very attractive.

http://users.du.se/~lrn/DUweb/
http://www.quantumforest.com/2011/10/linear-mixed-models-in-r/#idc-container

detecting orthologs among species

1. Markov Cluster Algorithm
http://micans.org/mcl/

2. OrthoMCL
http://orthomcl.org/cgi-bin/OrthoMclWeb.cgi?rm=indx

OrthoMCL-DB Version 5 is released. We have included 150 genomes in this release

2011年10月16日星期日

plots side by side - R

http://www.quantumforest.com/2011/10/setting-plots-side-by-side/

library(ggplot2)
 
# Create first plot and assign it to variable
p1 = qplot(wt, mpg, data = mtcars,
           xlab = 'Car weight', ylab = 'Mileage')
 
# Create second plot and assign it to variable
p2 = qplot(wt, mpg, color = factor(cyl), data = mtcars,
           geom = c('point', 'smooth'),
           xlab = 'Car weight', ylab = 'Mileage')
 
# Define grid layout to locate plots and print each graph
pushViewport(viewport(layout = grid.layout(1, 2)))
print(p1, vp = viewport(layout.pos.row = 1, layout.pos.col = 1))
print(p2, vp = viewport(layout.pos.row = 1, layout.pos.col = 2))

"not in" - R command line

http://www.quantumforest.com/2011/10/not-in-in-r/

When processing data it is common to test if an observation belongs to a set. Let’s suppose that we want to see if the sample code belongs to a set that includes A, B, C and D. In R it is easy to write something like:
inside.set = subset(my.data, code %in% c('A', 'B', 'C', 'D'))
Now, what happens if what we want are the observations that are not in that set? Simple, we use the negation operator (!) as in:
outside.set = subset(my.data, !(code %in% c('A', 'B', 'C', 'D')))
In summary, surround the condition by !().

2011年10月13日星期四

some sentences on correlation

Correlation measures are among the most basic tools in statistical data analysis and machine learning.
They are applied to pairs of observations to measure to which extent the two observations
comply with a certain model. The most prominent representative is surely Pearson’s product
moment coefficient [1, 13], often nonchalantly called correlation coefficient for short. Pearson’s
product moment coefficient can be applied to numerical data and assumes a linear relationship as
the underlying model; therefore, it can be used to detect linear relationships, but no non-linear
ones.

Rank correlation measures [7, 10, 12] are intended to measure to which extent a monotonic
function is able to model the inherent relationship between the two observables. They neither
assume a specific parametric model nor specific distributions of the observables. They can be
applied to ordinal data and, if some ordering relation is given, to numerical data too. Therefore,
rank correlation measures are ideally suited for detecting monotonic relationships, in particular, if
more specific information about the data is not available. The two most common approaches are
Spearman’s rank correlation coefficient (short Spearman’s rho) [14, 15] and Kendall’s tau (rank
correlation coefficient) [2, 9, 10]. Another simple rank correlation measure is the gamma rank
correlation measure according to Goodman and Kruskal [7].

The rank correlation measures cited above are designed for ordinal data. However, as argued in
[5], they are not ideally suited for measuring rank correlation for numerical data that are perturbed
by noise. Consequently, [5] introduces a family of robust rank correlation measures. The idea
is to replace the classical ordering of real numbers used in Goodman’s and Kruskal’s gamma [7]
by some fuzzy ordering [8, 3, 4] with smooth transitions — thereby ensuring that the correlation
measure is continuous with respect to the data.

cited from "RoCoCo-An R Package Implementing a Robust Rank Correlation Coefficient and a Corresponding Test".

Screening synteny blocks in pairwise genome comparisons

(1) the tools
http://www.biomedcentral.com/1471-2105/12/102

(2) the web-interfaced
http://genomevolution.org/CoGe/

2011年10月11日星期二

Inferring the Rate of Occurrence and Fitness Effects of Advantageous Mutations

A Method for Inferring the Rate of Occurrence and Fitness Effects of Advantageous Mutations

http://www.genetics.org/content/early/2011/09/26/genetics.111.131730.abstract 

http://homepages.ed.ac.uk/eang33/


Simulating tools for landscape genetics

Simulating natural selection in landscape genetics

http://onlinelibrary.wiley.com/doi/10.1111/j.1755-0998.2011.03075.x/full

2011年10月10日星期一

annotate your gene with gene superfamily and GO

Three tools you need to take their advantages:
1. BioMart, this is just a interface for many databases
http://www.biomart.org/index.html

2. InterPro, is an integrated database of predictive protein "signatures" used for the classification and automatic annotation of proteins and genomes. InterPro classifies sequences at superfamily, family and subfamily levels, predicting the occurrence of functional domains, repeats and important sites. InterPro adds in-depth annotation, including GO terms, to the protein signatures.

http://www.ebi.ac.uk/interpro/

the publication for InterPro
http://database.oxfordjournals.org/content/2011/bar033.full

all the gene superfamily list
http://www.ebi.ac.uk/interpro/ISearch?mode=db&query=Y

3.
The SUPERFAMILY annotation is based on a collection of hidden Markov models, which represent structural protein domains at the SCOP superfamily level. A superfamily groups together domains which have an evolutionary relationship. The annotation is produced by scanning protein sequences from over 1,700 completely sequenced genomes against the hidden Markov models.

http://www.supfam.org/SUPERFAMILY/index.html

2011年10月7日星期五

libsequence - for population genomic studies 群体基因组学必备

 libsequence,无疑是群体基因组学的必备利器。它可以帮你方便的计算多数群体遗传参数,尤其是对于大规模、高通量的数据,它的效用就更明显。

这是一些注释文件:

http://molpopgen.org/software/libsequence/doc/html/index.html
http://molpopgen.org/software/libsequence/doc/html/classSequence_1_1PolySNP.html

2011年10月2日星期日

Venn diagram tools

1. venn {gplots} works on up to 5 sets,
2. Plotting Venn diagrams in R
     https://stat.ethz.ch/pipermail/r-help/2003-February/029393.html
3. Venn Diagrams with R?  
       http://stackoverflow.com/questions/1428946/venn-diagrams-with-r
4.  Vennerable package not available now for R.
5.  venneuler package, not accurate
6.  VennDiagram package, not work on my data
7.   http://biostar.stackexchange.com/questions/7736/tool-to-generate-proportional-venn-diagrams

GWAS 中LD和haplotype长度的影响

Mapping Rare and Common Causal Alleles for Complex Human Diseases

 http://www.cell.com/abstract/S0092-8674%2811%2901069-5#MainText


Linkage Disequilibrium and Haplotype Lengths