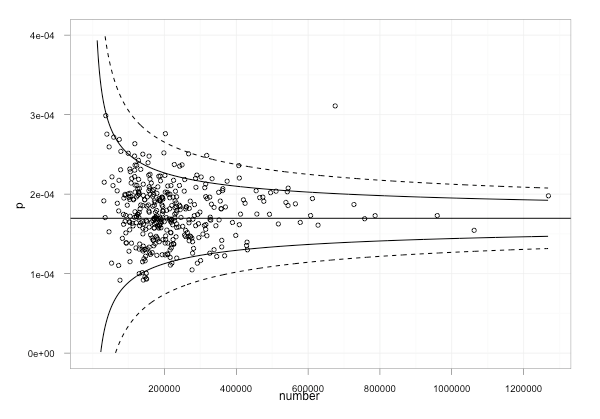
A funnel plot is a
scatterplot of treatment effect against a measure of study size. It is used primarily as a visual aid to detecting bias or
systematic heterogeneity. A
symmetric inverted funnel shape arises from a ‘well-behaved’ data set, in which publication bias is unlikely. An asymmetric funnel indicates a relationship between treatment effect and study size.
A
funnel plot is a useful graph designed to check the existence of
publication bias in
systematic reviews and
meta-analyses. It assumes that the largest studies will be near the average, and small studies will be spread on both sides of the average. Variation from this assumption can indicate publication bias.
http://en.wikipedia.org/wiki/Funnel_plot
http://ouseful.files.wordpress.com/2011/10/cancerdatafunnelplot.png?w=600&h=419
没有评论:
发表评论