https://github.com/systematicinvestor/SIT
2. it has been introduced here:
http://systematicinvestor.wordpress.com/
3. plot.table function
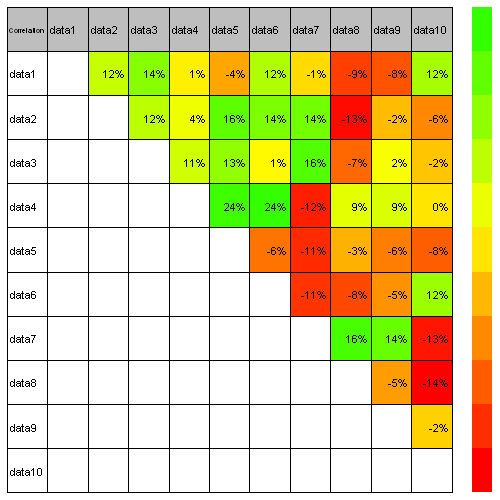
plot.table function in the Systematic Investor Toolbox is a flexible table drawing routine. plot.table has a simple interface and takes following parameters:
- plot.matrix – matrix with data you want to plot
- smain – text to draw in (top, left) cell; default value is blank string
- highlight – Either TRUE/FALSE to indicate if you want to color each cell based on its numeric value Or a matrix with colors for each cell
- colorbar – TRUE/FALSE flag to indicate if you want to draw colorbar

PloTA ( plot + ta ) library in the Systematic Investor Toolbox is a simple plot interface to charting Time Series and Technical Analysis plots. I created it as an alternative to charting functionality in quantmod package. It is designed to mimic default plot interface and works with xts objects. PloTA implements following methods:
- plota – main plot method
- plota2Y – add second Y axis to existing plot
- plota.lines – plot lines
- plota.candle – plot Candle
- plota.ohlc – plot Open/High/Low/Close
- plota.hl – plot High/Low
- plota.volume – plot Volume
- plota.scale.volume – scale Volume
- plota.grid – add grid
- plota.legend – plot legend
- plota.layout – specify plot layout
- plota.theme.blue.red – color theme
- plota.theme.green.orange – color theme
- plota.theme.gray.orange – color theme


没有评论:
发表评论