set operations in Unix shell
1. http://wordaligned.org/articles/shell-script-sets
2. http://www.catonmat.net/blog/set-operations-in-unix-shell-simplified/
2012年10月26日星期五
2012年10月24日星期三
CLEVER: Clique-Enumerating Variant Finder for Indels
Marschall T, Costa I, Canzar S, Bauer M, Klau GW, Schliep A, Schönhuth A.
Source
Centrum Wiskunde & Informatica, Amsterdam, the Netherlands, Federal University of Pernambuco, Recife, Brazil, Illumina, Cambridge, UK, Rutgers, The State University of New Jersey, Piscataway, NJ, USA.Abstract
MOTIVATION:
Next-generation sequencing techniques have facilitated large scale analysis of human genetic variation. Despite the advances in sequencing speed, the computational discovery of structural variants is not yet standard. It is likely that many variants have remained undiscovered in most sequenced individuals.RESULTS:
Here we present a novel internal segment size based approach, which organizes all, including concordant, reads into a read alignment graph where max-cliques represent maximal contradiction-free groups of alignments. A novel algorithm then enumerates all max-cliques and statistically evaluates them for their potential to reflect insertions or deletions. For the first time in the literature, we compare a large range of state-of-the-art approaches using simulated Illumina reads from a fully annotated genome and present relevant performance statistics. We achieve superior performance in particular for indels of length 20-100nt. This has been previously identified as a remaining major challenge in structural variation discovery, in particular for insert size based approaches. In this size range we outperform even split read aligners. We achieve competitive results also on biological data where our method is the only one to make a substantial amount of correct predictions, which, additionally, are disjoint from those by split-read aligners.AVAILABILITY:
CLEVER is open source (GPL) and available from http://clever-sv.googlecode.com.microsatellite genotyping from high-throughput resequencing data
Repetitive sequences are biologically and clinically important because they can influence traits and disease, but repeats are challenging to analyse using short-read sequencing technology. We present a tool for genotyping microsatellite repeats called RepeatSeq, which uses Bayesian model selection guided by an empirically derived error model that incorporates sequence and read properties. Next, we apply RepeatSeq to high-coverage genomes from the 1000 Genomes Project to evaluate performance and accuracy. The software uses common formats, such as VCF, for compatibility with existing genome analysis pipelines. Source code and binaries are available at http://github.com/adaptivegenome/repeatseq.
http://nar.oxfordjournals.org/content/early/2012/10/22/nar.gks981.full
http://nar.oxfordjournals.org/content/early/2012/10/22/nar.gks981.full
2012年10月23日星期二
Zotero -
http://www.zotero.org/
Zotero [zoh-TAIR-oh] is a free, easy-to-use tool to help you collect, organize, cite, and share your research sources. It lives right where you do your work—in the web browser itself.
It can work with Microsoft work or openoffice in Ubuntu. I could be used as Endnote. Really cool.
Zotero [zoh-TAIR-oh] is a free, easy-to-use tool to help you collect, organize, cite, and share your research sources. It lives right where you do your work—in the web browser itself.
It can work with Microsoft work or openoffice in Ubuntu. I could be used as Endnote. Really cool.
R tips
Local tips for R
|
Back to statistics
http://www.psychol.cam.ac.uk/statistics/R/
|
These pages provide a few short guides to getting going with R, a free statistical package.
- Installation.
- Obtaining a graphical user interface (GUI).
- At this point, I suggest you read the short guide by Owen (2007), The R Guide, in its entirety. This covers basic data entry, maths, and some statistics.
- Basics of R objects; entering and manipulating data.
- Input and output: scripts, saving and loading data (including database access).
- Basic statistics.
- Analysis of variance (ANOVA).
- Basic graphs (1).
- Basic graphs (2, with ggplot2).
- Graphs 3: more examples.
- Handy extensions to R.
Note some general points:
- Use q() to quit.
- Use help.search("keyword") or apropos("keyword") to find stuff in R.
- Use ?keyword for help on a particular topic.
- Use install.packages() to install new R packages (via a graphical interface), or install.packages("package").
- Use functionname (a function name without the usual brackets) to view the source code for a function. If this just shows a UseMethod call (e.g. try this for wilcox.test), then use methods(...) (e.g. methods(wilcox.test) ). That may show you a list of functions, including some non-visible ones. To see their source, use getAnywhere(...) (e.g. wilcox.test.default is listed, so use getAnywhere('wilcox.test.default') ).
- Press CTRL-L to clear the screen.
Typographical conventions used here:
# This is code (stuff you type into R). Hashes (#) indicate comments.
This is output (stuff that R shows you).
/* This is SPSS syntax (stuff you type into SPSS), for comparison to R. */
Other excellent introductions to R on the web include:
- Owen (2007) The R Guide.
- Quick-R (particularly aimed at users migrating from other statistical packages)
- An Introduction to R (from the R web site)
- Faraway JJ (2002) Practical Regression and ANOVA in R.
- Revelle W (2008) Using R for psychological research.
- Baron J & Li Y (2007) Notes on the use of R for psychology experiments and questionnaires.
- William Revelle's short list of the most useful R commands.
- Dong-Yun Kim's Statistical Computing with R: A Tutorial.
For other specific things:
- Glynn EF (2007) Using Color in R
Reference sources (less readable!), include:
- R Data Import/Export (from the R web site)
- The R Language Definition (more technical; from the R web site)
- The full set of R manuals (from the R web site)
books of Chinese traditional culture
蒙学启蒙类
格律章法类
唐诗三百首
工具书
诗史
其他
诗话词话
词
韵书
首选出版社
诗词软件
诗词游戏
《三字经》,《百家姓》,《千字文》,《声律启蒙》,《笠翁对韵》,《龙文鞭影》,《朱子格言》,《增广贤文》,《幼学琼林》。
《传统蒙学丛书》,江苏古籍出版社。
《中国古代文化常识》,马汉麟。
《中华新声韵律联选》,谢季荣(编著)。
《传统蒙学丛书》,江苏古籍出版社。
《中国古代文化常识》,马汉麟。
《中华新声韵律联选》,谢季荣(编著)。
《诗词格律概要》,王力;《诗词格律》,王力;
《诗词格律浅说》,贺巍;
《诗词韵律合编》,赵京战;
《诗词格律与章法》,林海权;
《格律诗写作技巧》,王永义;
《中国古典诗歌写作学》,经本植;
《诗词格律初阶》,施向东;
《格律诗词写作》,余浩然;
《诗法举隅》,林东海;
《诗词格律简洁入门》,张岳琦、张昕;
《实用绝句作法》,赵杏根;
《诗词格律手册》,王昕若;
《大众诗律》,严朴;
《声律启蒙与诗词格律详解》,袁庆述;
《绝句作法类举》,林青。
《诗词格律浅说》,贺巍;
《诗词韵律合编》,赵京战;
《诗词格律与章法》,林海权;
《格律诗写作技巧》,王永义;
《中国古典诗歌写作学》,经本植;
《诗词格律初阶》,施向东;
《格律诗词写作》,余浩然;
《诗法举隅》,林东海;
《诗词格律简洁入门》,张岳琦、张昕;
《实用绝句作法》,赵杏根;
《诗词格律手册》,王昕若;
《大众诗律》,严朴;
《声律启蒙与诗词格律详解》,袁庆述;
《绝句作法类举》,林青。
《唐诗三百首》,陈婉俊(补注);
《唐诗三百首新注》,金性尧;
《唐诗三百首详析》,喻守真;
《唐诗小札》,刘逸生;
《红楼梦诗词曲赋评注》,蔡义江。
《唐诗三百首新注》,金性尧;
《唐诗三百首详析》,喻守真;
《唐诗小札》,刘逸生;
《红楼梦诗词曲赋评注》,蔡义江。
《汉语诗律学》,王力;
《唐诗别裁集》,沈德潜;
《宋诗选注》,钱钟书;
《唐诗鉴赏辞典》,上海辞书出版社;
《宋诗鉴赏辞典》,上海辞书出版社;
《古诗源》,沈德潜。
《唐诗别裁集》,沈德潜;
《宋诗选注》,钱钟书;
《唐诗鉴赏辞典》,上海辞书出版社;
《宋诗鉴赏辞典》,上海辞书出版社;
《古诗源》,沈德潜。
《诗源辩体》,许学夷;
《唐诗小史》,罗宗强;
《诗》,叶君远;
《唐诗概论》,苏雪林;
《唐诗杂论》,闻一多。
《唐诗小史》,罗宗强;
《诗》,叶君远;
《唐诗概论》,苏雪林;
《唐诗杂论》,闻一多。
《诗境浅说》,俞陛云;
《诗词例话》,周振甫;
《诗词读写丛话》,张中行;
《诗歌鉴赏》,何其芳;
《周振甫讲古代诗词》,周振甫;
《顾随诗词讲记》,顾随(讲)、叶嘉莹(记);
《“迦陵说诗”系列》,叶嘉莹。
《诗词例话》,周振甫;
《诗词读写丛话》,张中行;
《诗歌鉴赏》,何其芳;
《周振甫讲古代诗词》,周振甫;
《顾随诗词讲记》,顾随(讲)、叶嘉莹(记);
《“迦陵说诗”系列》,叶嘉莹。
《历代诗话》(上、下),何文焕;
《历代诗话续编》(上、中、下),丁福保;
《人间词话》,王国维;
《蕙风词话》,况周颐。
《历代诗话续编》(上、中、下),丁福保;
《人间词话》,王国维;
《蕙风词话》,况周颐。
《读词常识》,夏承焘、吴熊和;
《宋词赏析》,沈祖棻。
《宋词赏析》,沈祖棻。
《诗韵新编》,上海古籍出版社;
《诗韵合璧》,汤文璐;
《现代诗韵》,秦似;
《袖珍诗韵》,林东海。
《诗韵合璧》,汤文璐;
《现代诗韵》,秦似;
《袖珍诗韵》,林东海。
中华书局;
上海古籍出版社;
岳麓书社。
诗词总汇;
诗词快车;
中华诗词;
稻香居作诗机。
《大唐诗录》。
2012年10月22日星期一
2012年10月18日星期四
qgraph - visualizing relationships as network
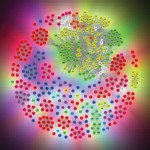
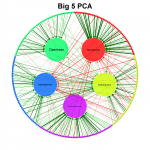
It is aimed at visualizing relationships in (psychometric) data as networks to create a clear picture of what the data actually looks like.
Its main use is to visualize correlation matrices as a network in which each node represents a variable and each edge a correlation. The color of the edges indicate the sign of the correlation (green for positive correlations and red for negative correlations) and the width indicate the strength of the correlation. Other statistics can also be used in the graph as long as negative and positive values are comparable in strength and zero indicates no relationship.
qgraph also comes with various functions to visualize other statistics and even perform analyses, such as EFA, PCA, CFA and SEM. The stable release of qgraph is available at CRAN, the developmental version of qgraph is available at GitHub and finally an article introducing the package in detail is available in the Journal of Statistical Software.
http://sachaepskamp.com/qgraph
2012年10月17日星期三
passing R variable to shell
You can use back-ticks (`) in most shells to capture output. So print
the value you want using R's cat() function, and capture it thus:
$ cat test.R
string <- 'TEST'
cat(string)
$ v=`R --slave --no-save < test.R `
$ echo $v
TEST
bash shell also allows $( ) notation:
$ v=$(R --slave --no-save < test.R )
note the use of --slave to make R shut up about itself.
the value you want using R's cat() function, and capture it thus:
$ cat test.R
string <- 'TEST'
cat(string)
$ v=`R --slave --no-save < test.R `
$ echo $v
TEST
bash shell also allows $( ) notation:
$ v=$(R --slave --no-save < test.R )
note the use of --slave to make R shut up about itself.
2012年10月16日星期二
Best visualization APIs for conserved gene cluster
This is a really good question from BioStar.
http://www.biostars.org/post/show/54989/best-visualization-apis-for-conserved-gene-clusters/
http://www.biostars.org/post/show/54989/best-visualization-apis-for-conserved-gene-clusters/
Each gene comes with its coordinates and its direction (+/-). I don't need homology search.
I would like to automate the generation of images that visualize the conserved neighborhoods.
The result should look like this:
Genome 1 ----------|||||||||||||||| >----------||||||||||| > ------------- < ||||||||||||||| ----------
Genome 2 -----|||||||||||||||| >----------||||||||||| > ------------- < ||||||||||||||| ---------------
Genome 3 ----------|||||||||||||||| >---||||||||||| > -------------------- < ||||||||||||||| ----------
...
...
Genome N ----------|||||||||||||||| >----------||||||||||| > ------------- < ||||||||||||||| ----------
Network enrichment analysis
http://www.biomedcentral.com/1471-2105/13/226/abstract
Background
Gene-set enrichment analyses (GEA or GSEA) are commonly used for biological characterization of an experimental gene-set. This is done by finding known functional categories, such as pathways or Gene Ontology terms, that are over-represented in the experimental set; the assessment is based on an overlap statistic. Rich biological information in terms of gene interaction network is now widely available, but this topological information is not used by GEA, so there is a need for methods that exploit this type of information in high-throughput data analysis.
Results
We developed a method of network enrichment analysis (NEA) that extends the overlap statistic in GEA to network links between genes in the experimental set and those in the functional categories. For the crucial step in statistical inference, we developed a fast network randomization algorithm in order to obtain the distribution of any network statistic under the null hypothesis of no association between an experimental gene-set and a functional category. We illustrate the NEA method using gene and protein expression data from a lung cancer study.
Conclusions
The results indicate that the NEA method is more powerful than the traditional GEA, primarily because the relationships between gene sets were more strongly captured by network connectivity rather than by simple overlaps.
2012年10月12日星期五
create array in shell
1.
#!/usr/bin/bash
declare -a mon
mon=( Jan Feb Mar Apr )
echo ${#mon[*]}
echo ${mon[2]}
2. variable and array
array[0]="value1"
array[1]="value2"
echo ${array[0]}
echo ${array[1]}
2012年10月10日星期三
2012年10月9日星期二
SeaView - tool for phylogenetics
http://pbil.univ-lyon1.fr/software/seaview.html
SeaView is a multiplatform, graphical user interface for multiple sequence alignment and molecular phylogeny.
SeaView is a multiplatform, graphical user interface for multiple sequence alignment and molecular phylogeny.
- SeaView reads and writes various file formats (NEXUS, MSF, CLUSTAL, FASTA, PHYLIP, MASE, Newick) of DNA and protein sequences and of phylogenetic trees.
- SeaView drives programs muscle or Clustal Omega for multiple sequence alignment, and also allows to use any external alignment algorithm able to read and write FASTA-formatted files.
- Seaview drives the Gblocks program to select blocks of evolutionarily conserved sites.
- SeaView computes phylogenetic trees by
- parsimony, using PHYLIP's dnapars/protpars algorithm,
- distance, with NJ or BioNJ algorithms on a variety of evolutionary distances,
- maximum likelihood, driving program PhyML 3.0.
- SeaView prints and draws phylogenetic trees on screen, SVG, PDF or PostScript files.
- SeaView allows to download sequences from EMBL/GenBank/UniProt using the Internet.
some NGS scripts
http://wiki.bioinformatics.ucdavis.edu/index.php/Data_Analysis
- fastqForensics.pl .. simple report on possible quality encoding formats for a fastq file (Joe Fass)
- count_fasta.pl .. obtain length histogram, GC-content, etc. for sequences in a fasta-format file (Brad Sickler / Joe Fass)
- Nx.pl .. calculate "Nx" stat for a set of sequences in fasta format (Joe Fass)
- fasta1line.pl .. remove newlines to put all sequence on one line following header line, for all sequences in a fasta-format file (Joe Fass)
- fakefastq.pl .. need fastq, and you only have fasta? fake it! {Joe Fass)
- rc.pl .. reverse complement a set of fasta-format sequences (Joe Fass)
- rcFastq.pl .. reverse complement a set of single-line fastq sequences (Joe Fass)
- trim.pl .. trim paired-end fastq files based on quality using a variety of trimming methods (Nikhil Joshi)
- subsequence.pl .. cut out a sub-sequence from sequences and qualities in a fasta/q-format file (Joe Fass)
- SeqQA.pl .. Sequence qualitative analysis for fasta and fastq files (Hans Vasquez-Gross)
- IllQ2SanQ.pl .. Convert Illumina (pipeline 1.3 and above) fastq format to Sanger fastq format (cat sequence.txt | ./IllQ2SanQ.pl > sequence.fastq) (Joe Fass)
- illTrim.pl .. trim Illumina read 3' ends at the first "bad" base .. takes and produces fastq (cat sequence.fastq | ./illTrim.pl > sequence.trimmed.fastq) (Joe Fass)
- trimBWAstyle.pl .. trimming script for oneline fastq, based on Heng Li's clipping algorithm implemented in bwa (for all-bad reads, substitutes one "N") (Joe Fass)
- trim.slidingWindow.pl .. trimming script for oneline fastq, using a sliding window; chucks reads that get trimmed too short (Joe Fass)
- subset_fastq.pl .. get subset of fastq records based on fraction or number of records desired (Nikhil Joshi)
- export2fastq.pl .. convert Illumina's "export.txt" format into fastq (no quality conversion, so equivalent to their "sequence.txt" files) (Joe Fass)
- fastq3pAdapterTrim.pl .. rudimentary 3'-adapter trimming; allows 1-mismatch down to a minimum length of adapter 5'-end (Joe Fass)
- SNPseqRetrieve.pl .. generate SNP sequences in a tab-separated-value format, including flanking sequence from read consensus or reference genome when no reads mapped (Joe Fass)
QIIME scripts
http://qiime.org/scripts/
We’re very excited to announce the 1.5.0 release of QIIME, which is available for download here. As always, you can find the latest QIIME AMI ID here, and we’ll be releasing the new VirtualBox images in one week. This release is packed with way too many exciting new features to mention all of them here, but here are some of the ones we’re most excited about.
* The biggest change in this release of QIIME is the switch to the BIOM format for representing OTU tables on disk and the biom-format objects for representing OTU tables in memory. You can find a discussion of the motivations for the switch here, but briefly it will support interoperability of related tools (e.g., QIIME, MG-RAST, mothur, and VAMPS), it provides a more efficient representation of sparse matrix data than tab-separated text, and it allows for storage of OTU counts, OTU metadata (e.g., taxonomy), and sample metadata (e.g., environmental parameters) in a single file. A manuscript describing the BIOM format is currently in press at GigaScience. You can find information about converting between BIOM-formatted and “classic”-formatted OTU tables here.
* Our AWS AMI now support use with StarCluster and the IPython Notebook. StarCluster provides an extremely convenient way to boot virtual clusters on the Amazon Cloud, and we think it will be key toward making very large analyses (e.g., based on several Illumina runs) accessible to groups without large compute clusters. Using StarCluster you can now easily run your QIIME analyses across multiple AWS instances: for example, you can boot 20 eight-processor instances to create a virtual cluster with 160 processors. The IPython Notebook provides a web-based interface for developing API and/or command line based workflows. These are easy to share with others as .ipynb files, or to publish with your journal articles. Using the IPython Notebook with the QIIME AWS images enables truly reproducible computation. You can find information on how to use these new features here.
* We’ve added a number of new statistical approaches via the compare_distance_matrices.pyand compare_categories.py scripts. These include Adonis, Anosim, BEST, Moran’s I, MRPP, PERMANOVA, PERMDISP, RDA, Partial Mantel, and Mantel Correlogram. Two new tutorials illustrate how and when to use these methods – you can find these here and here. This code was all developed for an undergraduate Computer Science capstone project at Northern Arizona University – their project website is here.
* We’ve added support for the RTAX method for performing taxonomy assignment inassign_taxonomy.py. RTAX is specifically designed for assigning taxonomy to paired-end reads, but additionally works on single-end reads. You can find a paper on RTAX here, and a tutorial describing how to use this new code here.
* Along with the switch to BIOM format for OTU tables, we’ve updated the cleaned up the interfaces, usage examples, and help text associated with many of the scripts in QIIME. Notable examples are the replacement of filter_otu_table.py withfilter_otus_from_otu_table.py, and the replacement of filter_by_metadata.py withfilter_samples_from_otu_table.py.
* Support for inserting sequences into trees has been added via the newinsert_seqs_into_tree.py script. This wraps the pplacer, RAxML, and ParsInsert applications.
* We’ve added the pick_subsampled_reference_otus_through_otu_tables.py, a more efficient open reference OTU picking workflow script for processing very large Illumina (or other) data sets. This is being used to process the Earth Microbiome Project data, so is designed to scale to tens of HiSeq runs. A new tutorial has been added that describes this process.
* The check_id_map.py code was completely refactored. It now creates html output to display locations of errors and warnings in the mapping file, so should provide a very convenient way to detect errors in your metadata mapping files.
* Added the start_parallel_jobs_sc.py script to support parallel jobs on SGE queueing systems, which is the default queueing system on StarCluster. This has only been tested on StarCluster at this point (hence ‘sc’ in the name), but we expect that it will work on other systems using SGE.
QIIME releases are massive collaborative efforts. Thanks to all of the developers for their hard work in making this release happen, and to our users for the suggestions, support, feature requests and bug reports. A lot of the QIIME developers will be at ISME this summer, so come find us and say hello!
nash-bioinformatics-codelets
http://code.google.com/p/nash-bioinformatics-codelets/downloads/list
订阅:
评论 (Atom)


