http://www.biostars.org/post/show/54989/best-visualization-apis-for-conserved-gene-clusters/
Each gene comes with its coordinates and its direction (+/-). I don't need homology search.
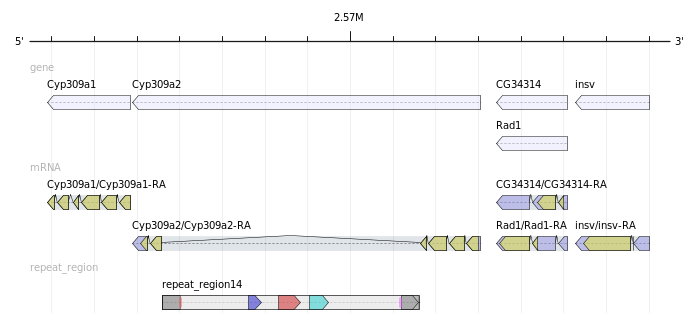
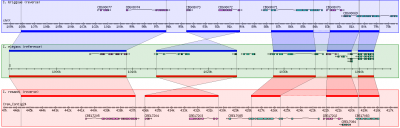
I would like to automate the generation of images that visualize the conserved neighborhoods.
The result should look like this:
Genome 1 ----------|||||||||||||||| >----------||||||||||| > ------------- < ||||||||||||||| ----------
Genome 2 -----|||||||||||||||| >----------||||||||||| > ------------- < ||||||||||||||| ---------------
Genome 3 ----------|||||||||||||||| >---||||||||||| > -------------------- < ||||||||||||||| ----------
...
...
Genome N ----------|||||||||||||||| >----------||||||||||| > ------------- < ||||||||||||||| ----------
没有评论:
发表评论